Self-handicapping, ability judgments, and self-esteem

The following post is a summary of some social psychology research from 2001 about the interplay between self-handicapping, ability, and self-esteem. While I focus mainly on neuroscience in general, I have many broad interests within psychology; hence, this post about social psychology.

McCrea & Hirt (2001) studied the effects of self-handicapping on ability judgments and self-esteem. In reviewing past literature the authors explained that while a lot of research was done on self-handicapping it was not clear whether global self-esteem affected ability judgments or vice versa, which was the basis of this study. Most self-handicappers apparently handicap themselves as a protective but not as an aggrandizing measure–it would be dangerous for a self-handicapper to have more expected of her or him. According to past research there are two reaction chains of relationships between self-handicapping, self-esteem, and personal beliefs of ability. As stated earlier attributions of ability either lead directly to self-esteem or to ability beliefs; in other words, people will attribute their success/failure on a test to either their personal abilities or external things (“I had to walk the dog and I didn’t have time to study enough”). The researchers’ hypothesis was that self-handicapping would have consequences on specific and global ability judgments which judgments were related to overall self-esteem.

The participants of the study were over 150 introductory psychology students (the majority were women) at Indiana University-Bloomington. There were three sessions of the study. In the first session the participants completed a self-handicapping scale and a self-esteem inventory. This session was done at the beginning of a the semester. The second session took place after at least one exam and just before another. In this session items were included that measured claimed handicapping behaviors such as textbook reading, studying, and other test preparations. The subjects also rated themselves on stress with a stress inventory. During the third session, which took place about a week after the next exam, the participants were asked about their performance on that exam. Then they rated how much the test was based on their own ability or if their score was a result of external forces (i.e. lack of study). There were also scales of other personal traits and the students’ current affect.

In this study the main items measured (the dependent variables) were: claims of poor preparation, claims of stress, test outcome, ability attribution, posttest self-esteem, posttest affect, academic ability, social competence, athletic ability, creativity, and psychology ability. The researchers did a regression for the analyses of these variables using the traits of self-handicapping, sex, and self-esteem as the independent variables. They classified four types of individuals: high self-handicapping (HSH), low self-handicapping (LSH), high self-esteem (HSE), and low self-esteem (LSE).

There were various self-handicapping measures (SHM) the authors looked at (the dependent variables). The first was claimed poor preparation. They found that men and HSH individuals claimed to have prepared less for the exams than did women or LSH individuals. They also found that HSE-HSH men prepared the least for the exam. The second SHM was claimed stress. HSH people reported more stress than LSH individuals but women and LSE individuals reported higher stress than men and HSE people. Overall, in test performance, HSH individuals did worse than LSH people. For ability attributions students blamed poor test performance on poor preparation and good test performance on personal ability, in general. For the posttest self-esteem measure the researchers found that HSH individuals had higher self-esteem whether they did well or poorly on the test.

In this study the authors found that self-esteem was higher the more individuals attributed their success to ability, which these researchers interpreted as ability attributions mediating claimed handicaps and self-esteem—so claimed handicaps affected ability attributions which in turn affected self-esteem. Generally, as far as ability ratings go, men and HSE individuals rate themselves as holding higher abilities than women and LSE individuals do. One interesting finding was that HSE-HSH men rated their abilities in psychology significantly higher than non HSE-HSH individuals even though they scored much lower on the test. This shows that the HSE-HSH persons had a scapegoat to blame for their poor performance­—poor preparation. Lastly, although global self-esteem slightly increased prediction of psychology ability ratings (those who had higher self-esteems could be shown to have slightly higher specific ability ratings), the psychology ability rating was a significant and large predictor of global self-esteem (those who rated their specific ability highly would have significantly higher overall self-esteem).

The authors’ interpretations of their statistics is that claimed handicaps affect ability beliefs and those beliefs then affect global self-esteem and not vice versa. So self-handicapping not only affects individuals overall self-esteem but more specifically, their “beliefs of ability in a threatened domain [in this case, students’ beliefs about how good they are at psychology]” (1388).

Reference

McCrea, S. M. & Hirt, E. R. (2001). The role of ability judgments in self-handicapping. Personality and Social Psychology Bulletin, 27, 1378-1389.

Intelligence Testing Introduced

Modern intelligence testing can be traced back to Alfred Binet, a French psychologist. The French government wanted a way to identify students who would do well in school, as well as students who would not benefit from schooling. They turned to Binet in 1904 to create an unbiased, objective measure that would help the government identify the children who needed special educational assistance. Binet and his colleagues created the first modern intelligence test by focusing on abilities like problem-solving and attention.Brain and cards
From this early beginning, intelligence testing evolved with modifications by Lewis Terman, who was at Stanford, and William Stern (who created the Intelligence Quotient {IQ}). Terman modified Binet’s work and created the Stanford-Binet intelligence test. This test remains in use today (it’s gone through a number of revisions), although it is not as popular as the Wechsler Adult Intelligence Scale (WAIS).
While early tests calculated the IQ based on “mental age” and “chronological age,” IQ is no longer calculated in this manner because of the problems this (mental age) / (chronological age) formula presents in adults.
The WAIS is set to have an average score of 100 and a standard deviation of 15. This means that a person with average intelligence would have an IQ of 100 (50% of scores are higher and 50% are lower, theoretically); however, the average IQ actually falls in the range of 85 to 115. A score between 110 and 115 is considered high average and scores between 90 and 85 can be considered low average. About 96% of the population have scores between 70 and 130, with 2% below 70 and 2% above 130.
While intelligence tests are not perfect and are rightly subject to much criticism, they are still quite useful for researchers, clinicians, and educational institutions.

Image by Echoside.

Blog for a personal side to Alzheimer’s Disease

I received a nice email from someone who runs a blog about caring for her father who has Alzheimer’s disease. She provides a nice perspective from the caregiver role of what it is like to deal with this disease.

http://www.knowitalz.com

Volunteering as Therapy for Individuals with Dementia of the Alzheimer’s Type

The following post is a lengthy exposition on a possible link between volunteering and Alzheimer’s disease. This post is more social psychology then neuroscience (actually, it has very little to do with neuroscience). I am not asserting that volunteering can be a useful therapy for someone with Alzheimer’s disease, rather I am making the case that there is enough evidence for research to be conducted along those lines. In other words, I see a need for someone to research whether or not volunteering is beneficial for people with Alzheimer’s disease.

Alzheimer’s disease (AD) is a serious condition that affects an estimated four million people in the United States. Most of these people are over the age 65, since the risk of developing AD increases with age. It is also estimated that there are currently over 400 thousand new cases of AD each year in the United States alone (Rodgers, 2002). The prevalence rate of Dementia of the Alzheimer’s Type (DAT), according to the Diagnostic and statistical manual of mental disorders–fourth edition (DSM-IV) is “between 2% and 4% of the population over the age 65 years…[and] the prevalence increases with increasing age, particularly after age 75 years” (American Psychological Association [APA], 1994). (In this post, the terms AD and DAT are used as interchange terms, even though DAT is the Axis I code and AD is the Axis III code in the DSM–IV. This is done because most articles about Alzheimer’s use the term “AD” in lieu of “DAT”). For this post, I will first give the DSM-IV diagnostic criteria for DAT. Then, I will discuss the effects of that volunteering has on older people. I will also provide some background theories about why volunteering has the effects that it does. Next, I will make the connection between AD and voluntarism.

DSM-IV Criteria for DAT

There are six main criteria associated with DAT as found in the DSM-IV. The first is:

“The development of multiple cognitive deficits manifested by both (1) memory impairment (impaired ability to learn new information or to recall previously learned information) [and] (2) one (or more) of the following cognitive disturbances: (a) aphasia (language disturbance), (b) apraxia (impaired ability to carry out motor activities despite intact motor function), (c) agnosia (failure to recognize or identify objects despite intact sensory function), (d) disturbance in executive functioning (i.e., planning, organizing, sequencing, abstracting)” (APA, 1994, p. 142).

Continue reading “Volunteering as Therapy for Individuals with Dementia of the Alzheimer’s Type”

At a conference

I just wanted to say that I’m at a conference in San Antonio, Texas for the next 5 days and might not be able to write any posts. Please visit the excellent sites in my Blogroll.

The Modal Model of Memory and the Serial Position Effect

I’m continuing my recent trend of basic cognitive psychology posts. The following post is about the Modal Model of memory, which has been highly influential for a number of decades but it is slowly being modified over time. I won’t get into the more modern modifications of the modal model, rather, in my post I present the very traditional view of memory, even if it is somewhat controversial today. For example, a number of psychologists do not believe that short term memory really exists (working memory fills in the gap). In any case, my post serves as a brief introduction to a classic view of memory and of the primacy and recency effects.

The modal model of memory has three main components. They are: sensory register, short-term memory (STM), and long-term memory (LTM). This Atkinson and Shiffrin model of memory assumes that the processes of moving information from the sensory store to short-term and then long-term memory takes place in discrete stages. At any of these stages information can be lost through interference or decay. Another assumption of this model is that information processing has to start in the sensory register and be attended to, then move to STM, and then to LTM with rehearsal.

The serial position effect (split into the primacy and recency effects) is that the first few and last few items in a word list, for example, are the easiest to remember. A graph of this effect would be roughly parabolic (i.e., U-shaped). The primacy effect occurs because people have time to rehearse the first few items until the STM capacity is reached. The recency effect occurs because the last items are still in STM and have not decayed yet so they are easy to remember. The items in the middle of lists are easy to forget because STM capacity is too full for much rehearsal by then and as more items are presented, older items in STM are “pushed out.”

Serial Position EffectThere are ways to hinder the primacy or recency effects though. If items are presented rapidly then there is not time to rehearse the items and the primacy effect fades away. If there is a distracting task given at the end of the main task (similar to Peterson and Peterson’s 1959 study testing the decay rate of STM), then the recency effect disappears due to STM capacity being taken up by the distracters, which leads to decay of the information in STM. These findings indicate that the systems governing primacy and recency effects are separate. The findings also gave support to the modal model because researchers identified the primacy effect with the transfer of STM into LTM. The recency effect is just an example of information being in STM.

PET Scans and fMRI Compared

PET Scanner
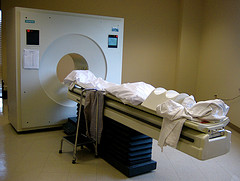
The positron emission tomography (PET) scan measures blood flow in the brain. This is accomplished by injecting a person or animal with a radioactive isotope (i.e. an unstable atom, usually a variation of oxygen that has a short-half life); this isotope will quickly decay. Founded on the assumption that blood flow will increase in areas of the brain that are in heavy use (such as when a person is viewing an object or reading words or some other cognitive-intensive function), a fair portion of the injected isotopes will end up in the active part of the brain. As the isotopes decay, a positron (a small particle with the exact opposite charge as an electron) is released. This positron will collide with an electron and they will annihilate each other, sending two gamma ray particles in exactly opposite directions. These gamma rays are picked up by the PET scanner, which then determines where they came from in the brain. Since blood should concentrate where the brain is activated, there should be higher levels of isotopes there and this will show up on the scanner in the form of increased levels of gamma rays. The test is usually run twice (once as the control condition and once as the experimental). The difference between the two conditions is measured and any difference should show what area(s) of the brain was (or were) activated.

A PET scan is similar to an fMRI in that both measure blood flow in the brain, which is an indirect measure of brain activity. However, there are advantages and disadvantages to both functional brain imaging methods. PET scans are advantageous in that a person does not have to remain as still as he or she would for the fMRI. Tiny movements can obscure and ruin fMRI data but small movements do not affect PET scans. So, for example, with a PET scan study a researcher could have someone read out loud lists of words but the simple jaw movements would ruin the fMRI data (although this is changing to some degree as image processing becomes more sophisticated; researchers also can modify the task slightly to reduce movement artifacts in fMR images). This is really the main advantage of PET over fMRI.

PET scanning is disadvantaged compared to fMRI because the resolution of the scans is lower. PET scans can measure changes in blood flow in the brain in an area of about 5-10 cubic millimeters. fMRI can resolve down to 3 cubic millimeters and even lower as the machines become more powerful. PET scanning is also much more expensive than fMRI since it takes a special machine, radioactive isotopes, and multiple trials to get a scan. fMRI’s can be done at many hospitals around the world with little or no extra cost because of the prevalence of MRI scanners. Another disadvantage PET’s have are needing radioactive isotopes to work. This isotope can be given only a few times before it is unsafe.

While PET scans were and are better in some situations than fMRI’s, they have many disadvantages overall. With higher cost, lower spatial resolution, and need for isotopes, the disadvantages of PET scans seem to outweigh the advantages.

Image by Muffet.

Word Superiority Effect and Parallel Processing

WordsOne experiment about cognitive brain functioning is the word superiority effect findings of Dr. Reicher in 1969. In this experiment either a word or a non-word (string of letters) is flashed on a screen. The subject is asked if the stimulus contained one of two letters, say a “C” or an “E”. When the stimulus did not resemble a word (e.g., XXCX) subjects were correct in identifying the target letter about 80% of the time. When the string of letters was similar to a word but not one (e.g., FELV) the subjects also correctly identified the target letter 80% of the time. However, the interesting finding was that when the stimulus was a word (e.g., TEND), subjects were correct in identification 90% of the time. So the word superiority effect is that subjects are most accurate in identifying a target letter when it is contained in a word as opposed to a string of letters.

This lends support to the theory that there are things that we can process in parallel and that that parallel processing (or parallel activation of word and letter) can be beneficial at times (such as helping subjects correctly identify individual letters more often when the letter is contained within a word rather than in a random string of letters). In other words, the whole word is recognized before all the letters individually are recognized. This then speeds up or aids processing because there are now a couple routes, per se, to that letter; there is the visual stimulus (seeing the letter) and the linguistic information (knowing that the letter is in the word) that both are activated and help people recognize letters better.

Image by uncommonmuse.

Quick post

I’m really sorry for not posting as much as I would like to. I’ve been preparing for a presentation at a research conference next week (Vas-Cog) and haven’t had time to write a good post for the blog. Anyway, LiveScience has an interesting story about new research localizing visual mistake recognition in the temporal lobes. This recognition appears to occur faster than conscious awareness.

A basic introduction to fMRI and MRI

MRI scannerfMRI (functional magnetic resonance imaging) builds on a basic MRI (magnetic resonance imaging) by looking at blood flow. An MRI works because protons, which make up atoms, are affected by magnetic fields. Basically, an MRI aligns a very small proportion of the protons in body tissue (it usually affects hydrogen the most because of hydrogen’s proton and neutron composition; hydrogen is also prevalent in body tissue and so it is easy to affect). Normally the protons in hydrogen are randomly orientated which means their minute magnetic fields are also randomly orientated. When these protons are placed in the vicinity of the strong magnetic field produced by MRI machines, some of them align with the magnetic field of the machine. The machine also produces radio waves that slightly affect the aligned protons. These waves will cause the protons to spin a certain way in response to the radio waves. The radio waves are then turned off and the protons realign themselves to the magnetic field produced by the MRI machine. The machine picks up this re-alignment and a computer processes it to create an image of the brain (or what ever else is scanned). Since protons in different tissues align at different rates, the machine can differentiate between different types of tissue (such as skull and white and gray matter).

An fMRI just builds on the MRI by focusing on the ratio between oxygenated to deoxygenated blood; this is the blood oxygenation level dependent effect (BOLD effect). Basically, an fMRI indirectly measures brain activity by measuring the change in blood levels (specifically hemoglobin as it deoxygenates). An fMRI works because as brains process information blood flows to those areas to help provide the needed oxygen and glucose. The result of this process is a scan of the brain with lighter (or darker) areas where blood is flowing in greater quantity.

One example of how an fMRI was used to test a cognitive neuroscience theory was when Deibert et al. (1999) had subjects close their eyes and try to identify objects only by touch. The researchers discovered through fMRI that the subjects’ visual cortex was activated even though their eyes were closed. There were two different explanations: first the objects were identified and then visual images were created or the visual image was created during the process of identification and thus helped the subjects recognize the objects. However, fMRI alone was not sufficient to support the correct theory. When researchers used transcranial magnetic stimulation (TMS) they discovered that they could interrupt the processing in the occipital lobe and interfere with object recognition. So the combination of fMRI and TMS showed that the visual image formed during tactile exploration is important for object recognition. While fMRI was not sufficient in this case, it was key in uncovering and explaining the theory about how tactile object recognition works in the absence of visual input.

Image courtesy of MacRonin47.