MRI Quenching

I learned something new this week. Modern MRI scanners produce high-strength magnetic fields (typically 1.5T up to about 20T – scanners for use with humans max out at about 7T right now {those are very rare though, 1.5T and 3T are more common). To produce these fields the scanners need to have strong electric currents. In order to handle large currents, scanners use superconductors cooled with liquid helium. In cases of serious malfunction or emergency the MRI scanner can be quenched, which releases all of the liquid helium. The helium turns into a gaseous state rapidly and expands to fill the room. The quench will make a loud sound like a jet engine or a pop. If the room is small enough, all of the air can be pushed out as the helium expands and increases the pressure. Most MRI rooms have fail-safe systems that release the helium outside, which prevents the occupants from suffocating.MRI Quench

Image from here.

Cool Image of Ventricles in the Brain

For my research, I’ve been spending time processing brain MRIs and measuring the volume of the brain and lateral ventricles. Here is an image of one of the brains (visualization by FSLView 3.0, with ventricles measured by ITK-Snap). The image is slightly messy because the brain did not extract perfectly (separating brain from non-brain). Also, portions of the ventricles are missing (especially the occipital and temporal horns) due to imperfect MRI resolution and processing. The ventricles are viewed through a cut-away of the 3D-rendered brain.

Ventricles in brain

Note: You MAY NOT use this image without express written consent from me.

Diffusion Tensor Imaging and High Angular Resolution Diffusion Imaging

I attended an interesting lecture this week. The professor who spoke talked about Diffusion Tensor Imaging (DTI) as well as about a newer technology they are trying to help develop – High Angular Resolution Diffusion Imaging (HARDI). DTI is based on tensor mathematics and physics. The tensor in DTI is basically a 3×3 matrix (x, y, and z planes) of numbers that represent the diffusion per voxel in the brain. A voxel is a volumetric pixel – a 3D portion of the brain in MR imaging. The highest resolution we can typically get with clinical MR scanners is a cubic mm voxel. So with DTI we have a tensor, a matrix, that describes the diffusion of water molecules within each voxel in the brain. Diffusion in a jar of water or in the ventricles of the brain tends to be fast and spherical. It is less spherical in the gray matter and even less so in the white matter. In fact, the diffusion of water is highly directional in white matter (the myelinated axons of neurons). This means that the water molecules tend to diffuse somewhat parallel to the length of the axon. The movements of these water molecules are picked up by the MR scanner (which is technically “focusing” on the hydrogen atoms in water).
The diffusion per voxel can be quantified by measures of fractional anisotropy (how directional is the movement), Mean Diffusivity (total diffusion within the voxel), and by the eigenvalues of the matrix (basically how far the molecules moved in the direction of the eigenvector).
Back to HARDI. HARDI improves upon DTI by allowing for more directions of the white matter fibers to be separated out than is possible with DTI. There are some areas of the brain where there are a lot of crossing fibers and these areas show up as dark spots on DTI (which looks like a hole in the brain). With HARDI, you can see that the fibers are just more complex than is possible to calculate with DTI.
Both of these methods are useful for measuring the overall integrity (and potentially connectivity) of the white matter in the brain.

The 3D brain

Technology Review has an interesting article about “new” 3D brain imaging software being developed at Thomas Jefferson University Hospital in Philadelphia, PA (I put “new” in quotation marks because there are other similar programs out there; they might not be as polished but some are even open source). Their software fuses MRI, fMRI, and DTI together to create a fairly comprehensive view of the brain: “The fusion of these different images produces a 3-D display that surgeons can manipulate: they can navigate through the images at different orientations, virtually slice the brain in different sections, and zoom in on specific sections.”

The software looks like it is aimed more at neurosurgeons than researchers (i.e., it probably isn’t free like a lot of MRI image processing software). It does produce amazing images (view the images here) and looks like it could be a very useful tool for at least a qualitative approach to brain imaging.

DTI fibers near a tumor

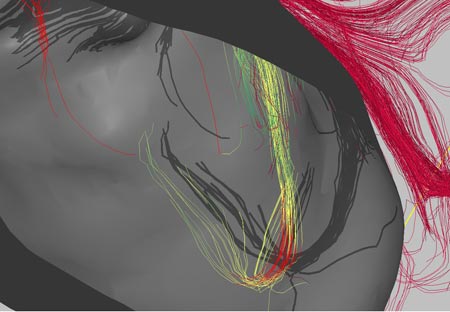
The software is focused a lot on DTI (diffusion tensor imaging) and how the white matter fibers in the brain interact with lesions or tumors. I think that one researcher’s word of caution is important:

“Bruce Fischl, an assistant in neuroscience at Massachusetts General Hospital, says that the idea is ‘interesting’ but cautions that there are a number of levels of ambiguity when talking about connectivity in imaging. ‘Just because you live next to the Mass Pike doesn’t mean that there is an exit,’ he says.”

In other words, don’t get too caught up in the fact that fibers are right by a tumor, they may not really have anything to do with the part of the brain the tumor is most affecting.

In any case, I think that the idea behind this software is amazing. The graphics renderings are impressive (but they are just the pretty pictures – the rendering details may be beneficial in clinical surgery settings but they are not particularly useful in research situations, other than producing nice pictures to go in your publication). This software is very similar to something that I envisioned using a few years ago and I’m glad to see it being developed.

Image credit: Song Lai, Thomas Jefferson University Hospital (borrowed via technologyreview.com)

The basics of MRI

For a simply fabulous introduction to magnetic resonance imaging (MRI) visit Dr. Hornak’s site: http://www.cis.rit.edu/htbooks/mri/

It provides a basic but very in-depth overview of MR imaging, including the statistics and physics behind the images. It’s probably the best freely-available resource about MRI on the web.

PET Scans and fMRI Compared

PET Scanner
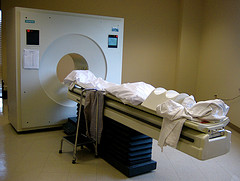
The positron emission tomography (PET) scan measures blood flow in the brain. This is accomplished by injecting a person or animal with a radioactive isotope (i.e. an unstable atom, usually a variation of oxygen that has a short-half life); this isotope will quickly decay. Founded on the assumption that blood flow will increase in areas of the brain that are in heavy use (such as when a person is viewing an object or reading words or some other cognitive-intensive function), a fair portion of the injected isotopes will end up in the active part of the brain. As the isotopes decay, a positron (a small particle with the exact opposite charge as an electron) is released. This positron will collide with an electron and they will annihilate each other, sending two gamma ray particles in exactly opposite directions. These gamma rays are picked up by the PET scanner, which then determines where they came from in the brain. Since blood should concentrate where the brain is activated, there should be higher levels of isotopes there and this will show up on the scanner in the form of increased levels of gamma rays. The test is usually run twice (once as the control condition and once as the experimental). The difference between the two conditions is measured and any difference should show what area(s) of the brain was (or were) activated.

A PET scan is similar to an fMRI in that both measure blood flow in the brain, which is an indirect measure of brain activity. However, there are advantages and disadvantages to both functional brain imaging methods. PET scans are advantageous in that a person does not have to remain as still as he or she would for the fMRI. Tiny movements can obscure and ruin fMRI data but small movements do not affect PET scans. So, for example, with a PET scan study a researcher could have someone read out loud lists of words but the simple jaw movements would ruin the fMRI data (although this is changing to some degree as image processing becomes more sophisticated; researchers also can modify the task slightly to reduce movement artifacts in fMR images). This is really the main advantage of PET over fMRI.

PET scanning is disadvantaged compared to fMRI because the resolution of the scans is lower. PET scans can measure changes in blood flow in the brain in an area of about 5-10 cubic millimeters. fMRI can resolve down to 3 cubic millimeters and even lower as the machines become more powerful. PET scanning is also much more expensive than fMRI since it takes a special machine, radioactive isotopes, and multiple trials to get a scan. fMRI’s can be done at many hospitals around the world with little or no extra cost because of the prevalence of MRI scanners. Another disadvantage PET’s have are needing radioactive isotopes to work. This isotope can be given only a few times before it is unsafe.

While PET scans were and are better in some situations than fMRI’s, they have many disadvantages overall. With higher cost, lower spatial resolution, and need for isotopes, the disadvantages of PET scans seem to outweigh the advantages.

Image by Muffet.

A basic introduction to fMRI and MRI

MRI scannerfMRI (functional magnetic resonance imaging) builds on a basic MRI (magnetic resonance imaging) by looking at blood flow. An MRI works because protons, which make up atoms, are affected by magnetic fields. Basically, an MRI aligns a very small proportion of the protons in body tissue (it usually affects hydrogen the most because of hydrogen’s proton and neutron composition; hydrogen is also prevalent in body tissue and so it is easy to affect). Normally the protons in hydrogen are randomly orientated which means their minute magnetic fields are also randomly orientated. When these protons are placed in the vicinity of the strong magnetic field produced by MRI machines, some of them align with the magnetic field of the machine. The machine also produces radio waves that slightly affect the aligned protons. These waves will cause the protons to spin a certain way in response to the radio waves. The radio waves are then turned off and the protons realign themselves to the magnetic field produced by the MRI machine. The machine picks up this re-alignment and a computer processes it to create an image of the brain (or what ever else is scanned). Since protons in different tissues align at different rates, the machine can differentiate between different types of tissue (such as skull and white and gray matter).

An fMRI just builds on the MRI by focusing on the ratio between oxygenated to deoxygenated blood; this is the blood oxygenation level dependent effect (BOLD effect). Basically, an fMRI indirectly measures brain activity by measuring the change in blood levels (specifically hemoglobin as it deoxygenates). An fMRI works because as brains process information blood flows to those areas to help provide the needed oxygen and glucose. The result of this process is a scan of the brain with lighter (or darker) areas where blood is flowing in greater quantity.

One example of how an fMRI was used to test a cognitive neuroscience theory was when Deibert et al. (1999) had subjects close their eyes and try to identify objects only by touch. The researchers discovered through fMRI that the subjects’ visual cortex was activated even though their eyes were closed. There were two different explanations: first the objects were identified and then visual images were created or the visual image was created during the process of identification and thus helped the subjects recognize the objects. However, fMRI alone was not sufficient to support the correct theory. When researchers used transcranial magnetic stimulation (TMS) they discovered that they could interrupt the processing in the occipital lobe and interfere with object recognition. So the combination of fMRI and TMS showed that the visual image formed during tactile exploration is important for object recognition. While fMRI was not sufficient in this case, it was key in uncovering and explaining the theory about how tactile object recognition works in the absence of visual input.

Image courtesy of MacRonin47.

The charitable accumbens

CharityCNN posted an interesting article about how when people choose to be charitable (i.e., give money away) that the nucleus accumbens, which is termed the “pleasure center” of the brain, and the caudate nucleus showed heightened activity. It’s turning out that the nucleus accumbens is involved in far more activities than we’ve ever realized. It’s an area of the brain that is heavily tied to the dopaminergic system and is directly tied to drug use, eating, sex, and pretty much anything else that people can enjoy. In addition, assumed dysfunction or dysregulation of the nucleus accumbens is tied to addictive behaviors. It’s not surprising then that a behavior that is enjoyable to so many – being charitable – is related to activity in the nucleus accumbens. Maybe some people are just Scrooges because they have too little dopamine in their brains [pure speculation and meant to be slightly humorous but it is a hypothesis that could be worth testing].

Image courtesy of benevolink

Neuroimaging and Image Analysis

A handy program I use to analyze MRI data is called FSL. “FSL is a comprehensive library of image analysis and statistical tools for FMRI, MRI and DTI brain imaging data. FSL is written mainly by members of the Analysis Group, FMRIB, Oxford, UK” (from the FSL website). It is powerful, flexible, and well-maintained. There is a very active community listserv too.

All of my research is structural MRI-based, so the main FSL tools I use are: Brain Extraction tool (BET), SUSAN (which reduces noise nonlinearly), FAST (an automated segmentation program that can separate the MR images into different tissue types), FLIRT (a linear registration program), and FUGUE (a program that can unwarp the MR images; there is often distortion in MRIs caused at scan acquisition by head movements or other problems).

I’ve been very pleased with the software so far. It’s free software and available to pretty much anyone for use. I have no affiliation with the software developers, I am just a pleased user of the software. I would post some of the images I’ve processed with FSL, however, due to IRB, HIPPA, and confidentiality limitations, I am unable to.

Link to neuroanatomy/MRI site

As a start towards discovering neuropsychology, understanding neuroanatomy is imperative; so here’s a great brain MRI website: The Whole Brain Atlas